Insights
In this case study, I will walk you through the development of a new feature for a SaaS platform focused on continuous improvement, specifically for the web version. The goal was to provide users with valuable data, trends, and insights that would drive actionable decisions.
Role
Principal Product Designer
Team
1x Product Director 1x Head of Engineering 1x Back-end 2x Front-end 2x Product Designer
Duration
3 months
Methodology
ShapeUp
Category
Product Design

Work Showcase
Problem
The platform offered a wide range of sections and a massive amount of unprocessed data. The only way users could gather data was by downloading raw reports, which required a significant time investment to extract trends and make estimates. This revealed the need to create a section that would display targeted data in a more accessible format.
The Process
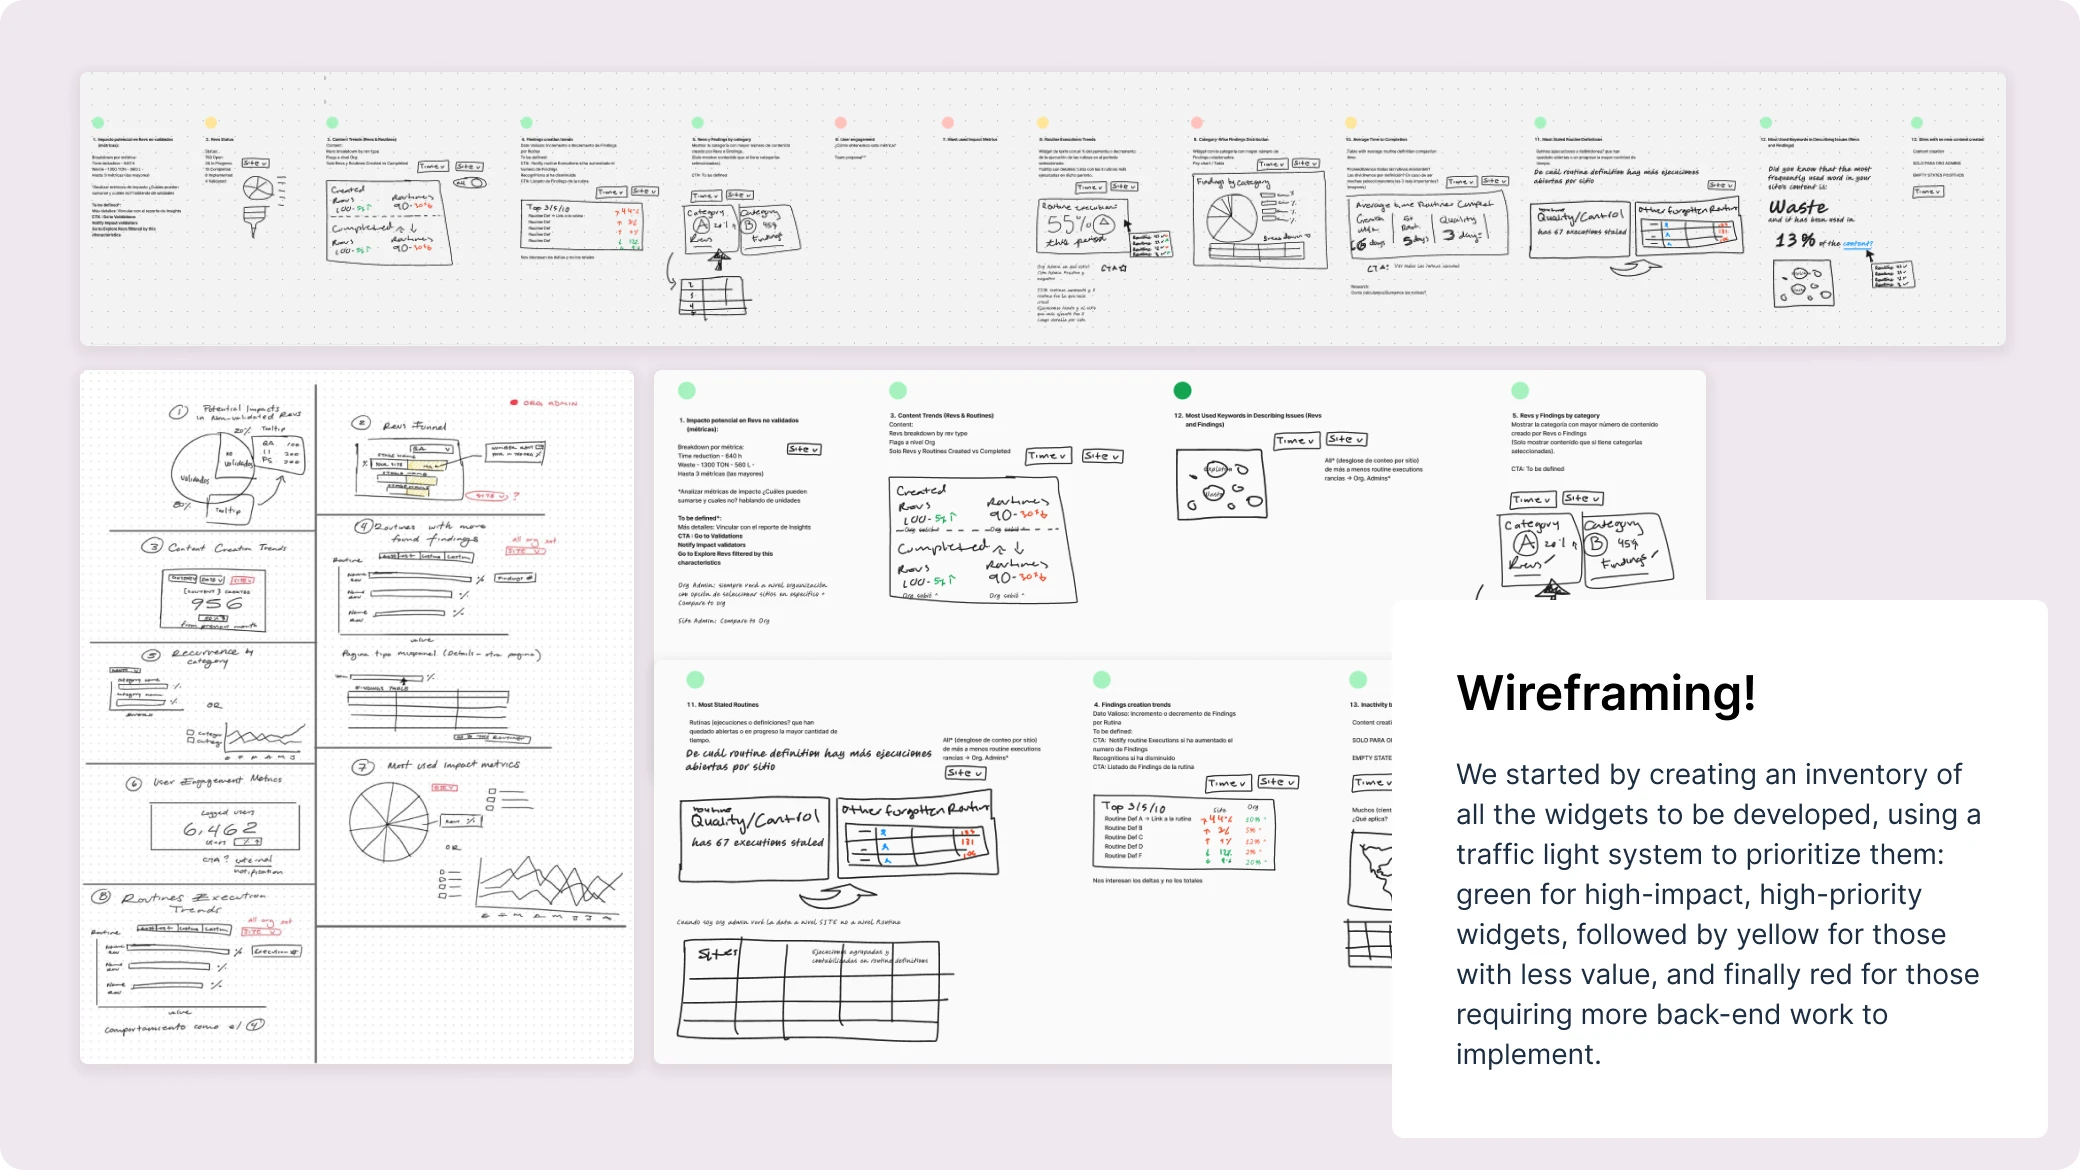
We started by creating a datasheet that highlighted the key insights our users were most eager to access. After a Crazy 8’s session with the project team, which was split into two phases, we proceeded with sketching, wireframing, and developing the UI for each widget within the section. We carefully considered use cases, user roles, and the visibility levels required for each.
Outcome
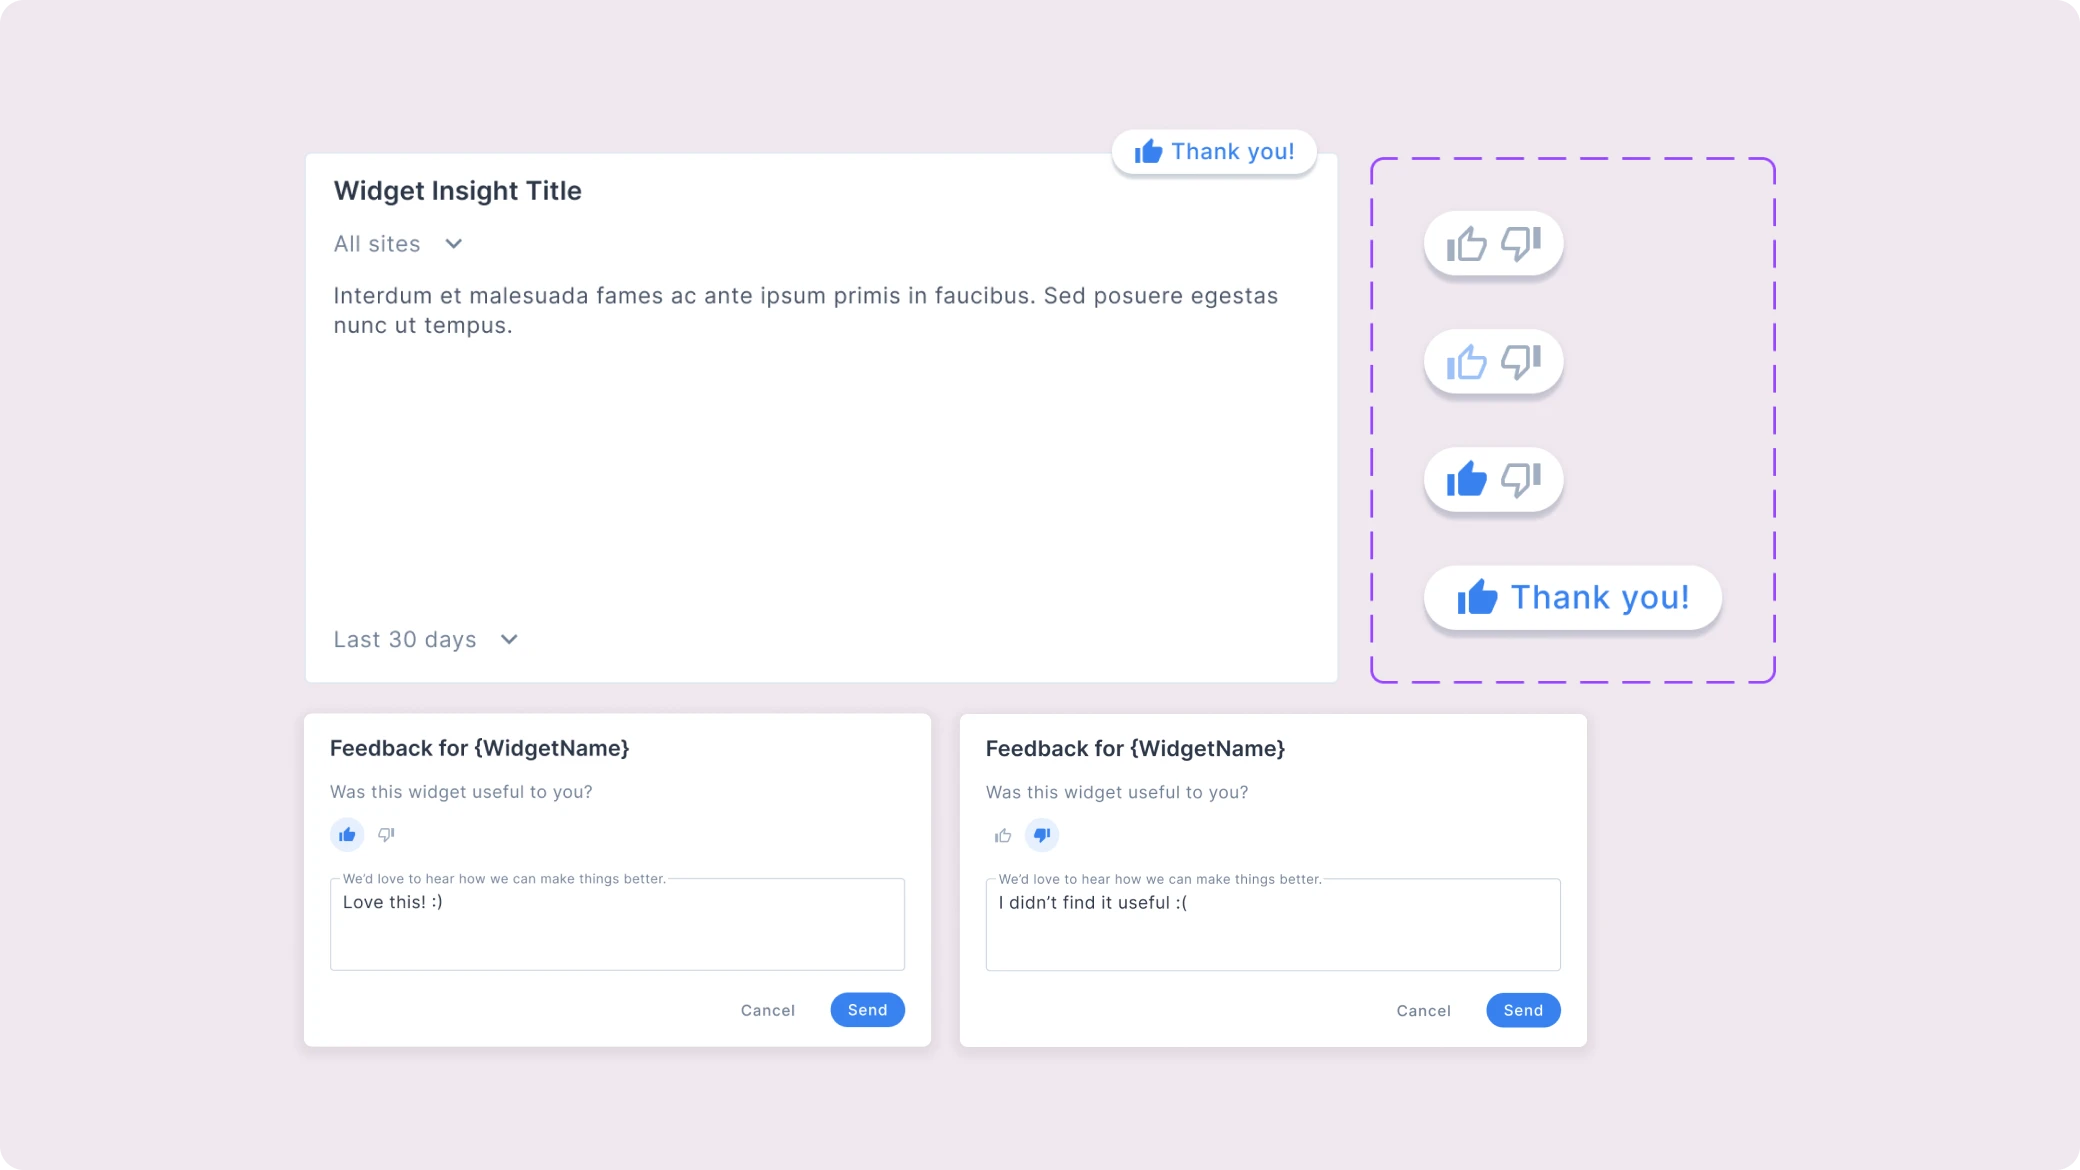
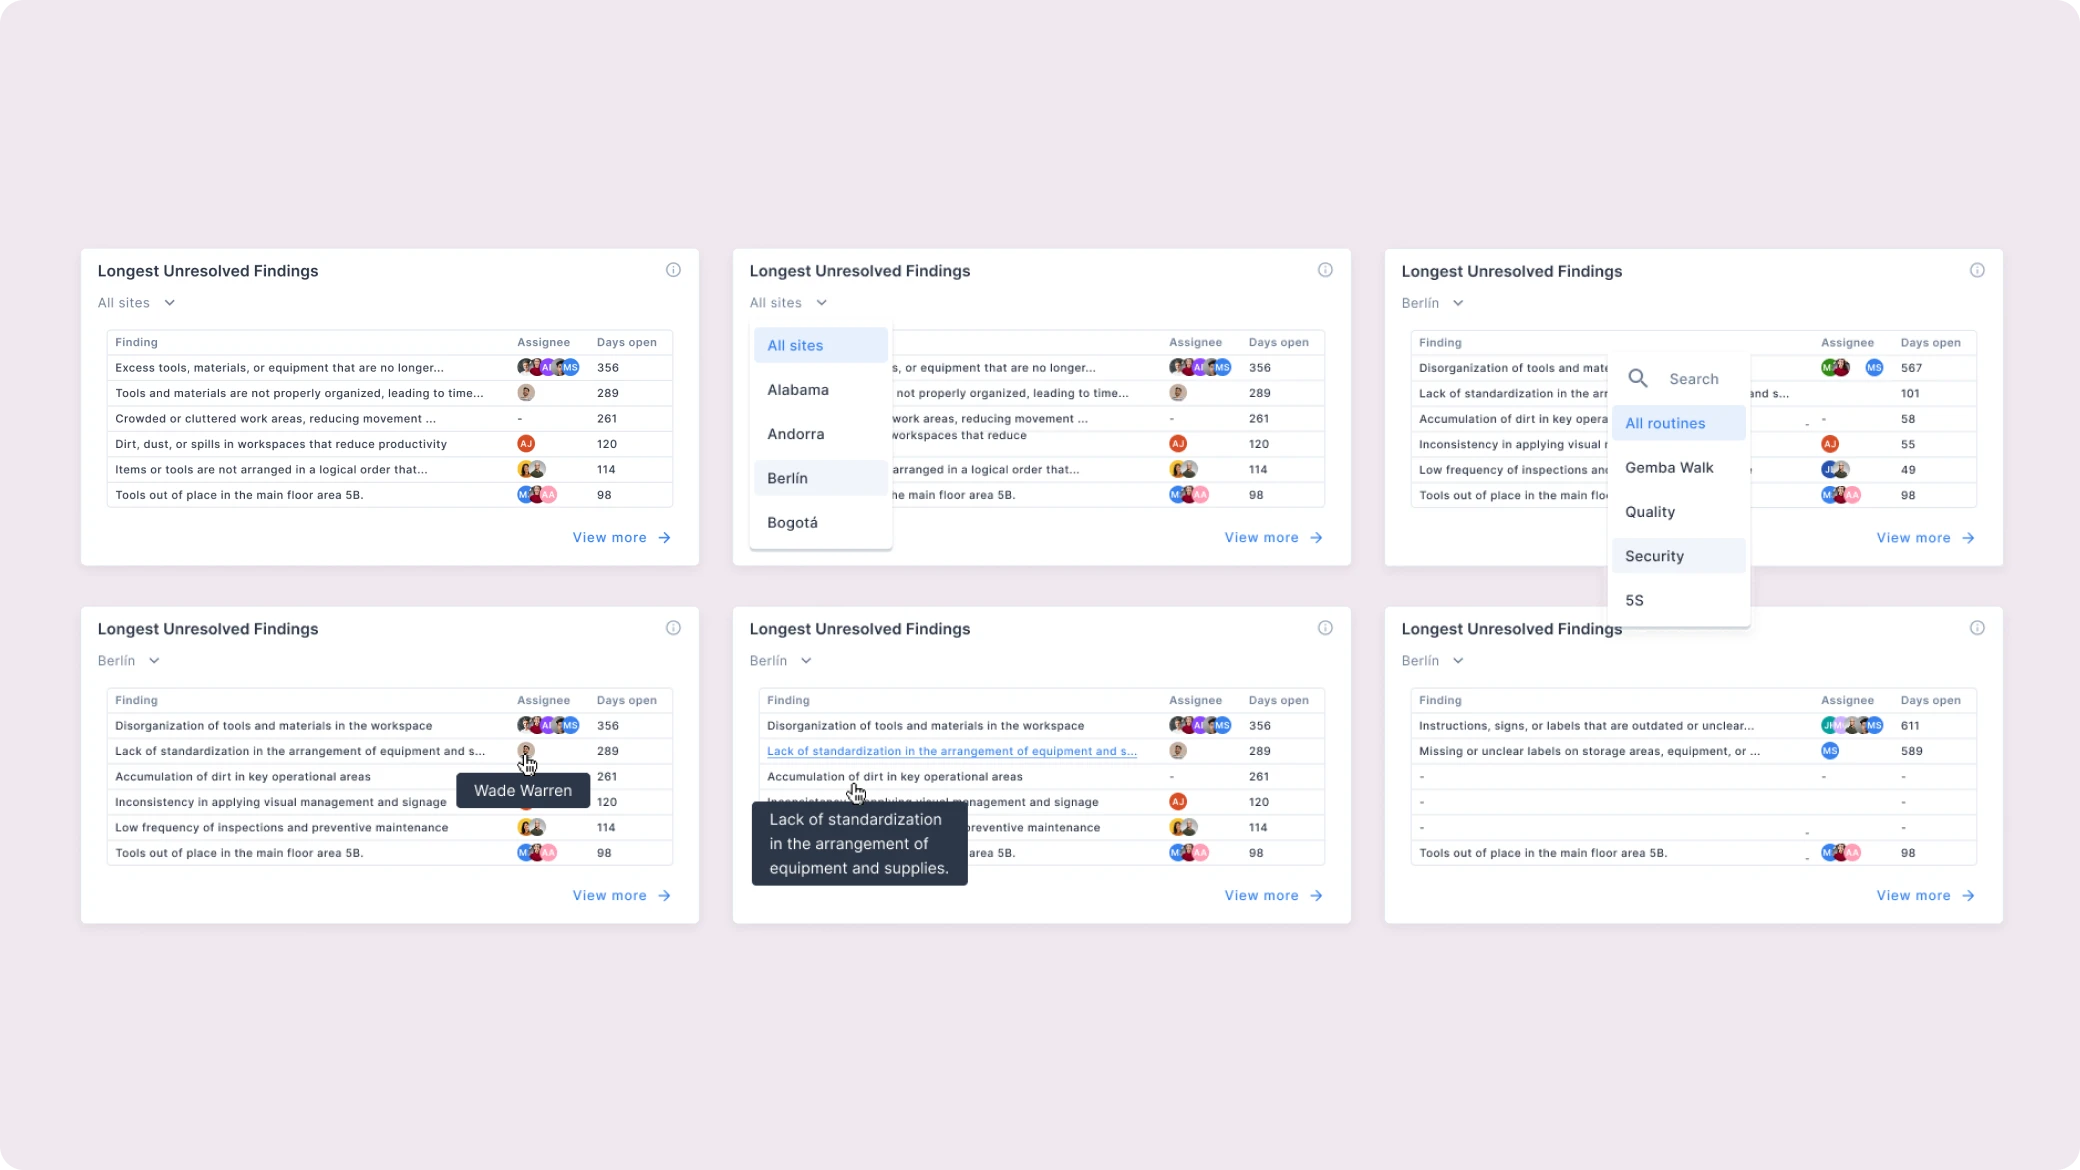
We restructured the Insights section into two subsections: "Insights" and "Reports." The newly developed "Insights" section featured widgets tailored to the most effective formats for presenting relevant information, with filters and controls customized for each use case.


Learnings
In this project, I learned to prioritize by organizing client feedback and requests into a matrix, balancing product value and impact against the effort or time needed for development. This helped clarify our starting point and direction for each step.
I also learned to collaborate even more closely with the engineering team, negotiating what needed to be done to achieve the desired functionality for a section that, in its final version, is expected to be customizable.

